In Touch EMR analytics provides a range of powerful insights with the click of a button.
With In Touch EMR analytics, you can take advantage of insight into the following categories:
- Patient Analysis
- Staff Productivity
- Clinic Comparator
- Revenue Predictor
- Appointment Tracking
Most of these components can be filtered by:
- Providers
- Clinics
- Time Frame
To visit the Analytics page, go to the Administration tab and choose Analytics
Patient Analysis
For patient analysis, the following are represented in visual charts:
- EMAIL REACH - The percentage of patients with valid email addresses. The more emails you have, the better your marketing reach.
- CELLPHONE REACH - The percentage of patients with cellphone numbers. The more cellphone numbers you have, the better your marketing reach.
- INSURANCE SPREAD - The percentage of patients with an insurance company on file.
- DEMOGRAPHIC DISTRIBUTION - The age distribution of your patients.
- GENDER DISTRIBUTION - The gender distribution of your patients. T
Staff Productivity
PROVIDER LIST- Allows users to filter the report to a specific provider within the clinic
CLINIC- allows users to filter the report to a specific clinic
TIME FRAME - Allows users to filter the report to either 7 days, 15 days or 30 days
CUSTOM- Allows users to customized the time period of the report
TOTAL SCHEDULED VISITS - The total number of scheduled patient visits in a particular period. This does not include canceled appointments. non billable appointments and no shows. It includes all other visit types (with the exception of ‘in progress’ and ‘finalized’, which are considered documented visits). Until a visit is binded to a note (or unbinded from a document in progress), it is considered a scheduled visit.
Therefore, the total scheduled visits are different from the total documented visits in the same time period.
As soon as a clinician ‘binds’ an appointment to a documented note in In Touch EMR, the visit is considered a ‘documented visit’. A documented visit is either ‘in progress’ or ‘finalized’. Detailed statistics about total documented visits are available in other analytics displays.
6. TOTAL DOCUMENTED VISITS - The total number of documented patient visits in a particular period (documents that are in progress, or in a finalized state). This includes all document types (initial evaluation, daily note, progress note, re-evaluation and discharge).
Ideally, the number of documented visits should be as close as possible to the number of scheduled visits in a given time period, across the entire clinic. If an appointment (visit) has not yet been ‘binded’ to a note, then that visit is considered ‘undocumented’ and it will not appear in the total documented visits. It will instead appear in the total scheduled visits.
These ‘unbinded’ visits result in a difference between total scheduled visits and total documented visits.
7. DOCUMENTATION FACTOR- The completion factor is a ratio. It is calculated when the total documented visits are divided by the total scheduled visits in a given time period. It is a measure of clinical efficiency and the highest possible value for the completion factor is 1. Ideally, the completion factor is 1 or close to 1.
8. TOTAL IN PROGRESS VISITS - The total number of ‘in progress’ patient visits in a particular period (documents that are in progress). This includes all document types (initial evaluation, daily note, progress note, re-evaluation and discharge).
Ideally, the number of ‘in progress’ visits should be as few as possible because you want most visits (in the past) to be in a ‘finalized’ state in a given time period across the entire clinic.
On the other hand, if an appointment (visit) has not yet been ‘binded’ to a note, then that visit is considered ‘undocumented’ and it will not appear in the total ‘in progress’ visits. It will instead appear in the total scheduled visits, which is another analytics component.
The sum total of the total number of ‘in progress’ visits and the total number of ‘finalized’ visits is equal to the total number of documented visits, which is another analytics component.
9. IN PROGRESS FACTOR - The ‘in progress’ factor is a ratio. It is calculated when the total ‘in progress’ visits are divided by the total ‘documented’ visits in a given time period. It is a measure of clinical documentation ‘lag time’ and the lowest possible value for the in progress factor is 0. Ideally, the in progress factor is 0 or close to 0 at any given time. The higher the in progress factor, the greater the probability that the clinician is lagging behind with documentation and unable to complete notes in a timely manner.
10. Total Finalized Visits - The total number of ‘finalized’ patient visits in a particular period (documents that are completed). This includes all document types (initial evaluation, daily note, progress note, re-evaluation and discharge).
Ideally, the number of ‘finalized’ visits should be as many as possible because it shows that documentation has been completed and claims have been submitted to the billing department. A high number of finalized documents is desirable in any given time period (in the past) across the entire clinic.
On the other hand, if an appointment (visit) has been ‘binded’ to a note but has not yet been completed, then that that visit is considered ‘in progress’ and it will not appear in the total ‘finalized’ visits. It will instead appear in the total ‘in progress’ visits, which is another analytics component.
The sum total of the total number of ‘in progress’ visits and the total number of ‘finalized’ visits is equal to the total number of documented visits, which is another analytics component.
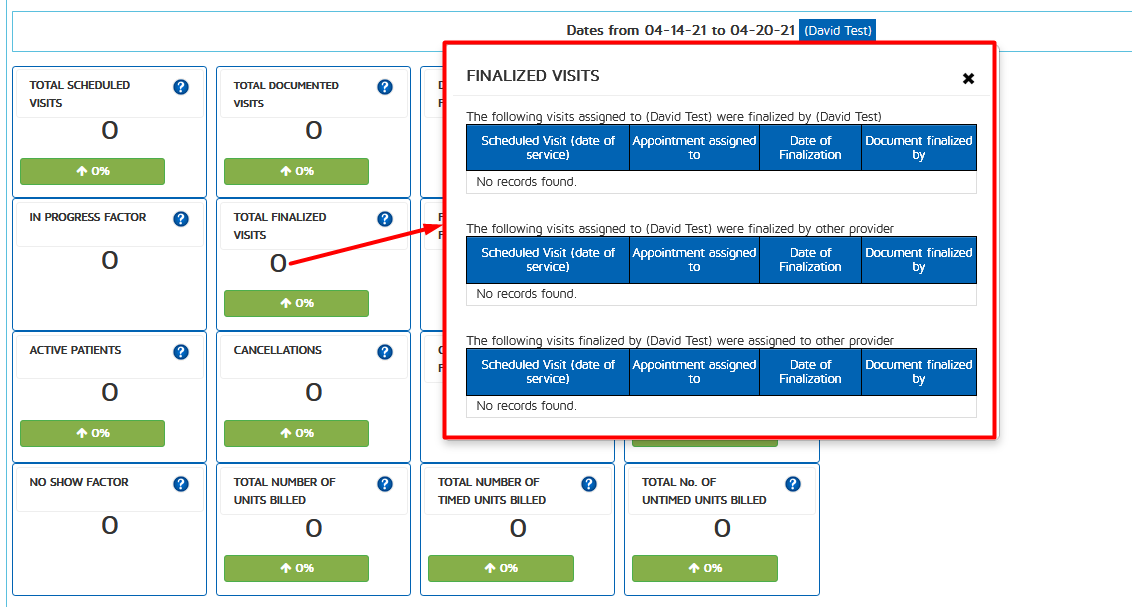
You may also click on the number of Total Finalized Visits to get a report of the actual appointments that were finalized.
You will see three tables from that report.
1. Appointments that were finalized within the selected duration.
2. Appointments assigned to the selected provider but were finalized by a different provider. (This will only have data if specific provider/s are selected)
3. Appointments that were assigned to a different provider but were finalized by the selected provider/s.
11. Finalization Factor - The ‘finalization’ factor is a ratio. It is calculated when the total ‘finalized’ visits are divided by the total ‘documented’ visits in a given time period. It is a measure of clinical efficiency and the highest possible value for the finalization factor is 1. Ideally, the finalization factor is 1 or close to 1 at any given time. It indicates most (if not all) documents are in a finalized state. This implies that the clinician is always current with his / her documentation and is completing notes in a timely manner.
12. New Patients - The number of new patients in a given time period, for selected clinicians and selected clinics. When the system detects an initial evaluation for a patient, it considers this as a new patient.
13. Current Patients - The number of active patients in a given time period, for selected clinicians and selected clinics. An active patient is ANY patient (including a new patient) for whom at least one document type was created within that given time period, for selected clinicians and selected clinics. Document types include initial evaluations, daily notes, progress notes, re-evaluations and discharge notes. The document type must be either ‘in progress’ or in a ‘finalized’ state for the patient to be considered active.
14. CANCELLATIONS The number of visits with a ‘cancelled’ status in a given time period, for selected clinicians and selected clinics.
15. Cancellation Factor - The cancellation factor is also a ratio. It is calculated when the total number of cancelled visits are divided by the total number of scheduled visits in a given time period. It is a measure of scheduling (front desk) efficiency and the lowest possible value for the cancellation factor is 0. Ideally, the cancellation factor is 0 or close to 0.
16. NO SHOWS - The number of visits with a ‘no show’ status in a given time period, for selected clinicians and selected clinics.
17. NO SHOW FACTOR - The no show factor is also a ratio. It is calculated when the total number of no show visits are divided by the total number of scheduled visits in a given time period. It is a measure of scheduling (front desk) efficiency and the lowest possible value for the no show factor is 0. Ideally, the no show factor is 0 or close to 0.
18. TOTAL NUMBER OF UNITS BILLED - The total number of units billed in a particular period (based on the data in the claim review page of each note that is finalized by the rendering provider) takes all units in all document types into consideration. These document types include the initial evaluation, daily note, progress note, re-evaluation and discharge.
The total number of units billed (as well as the CPT codes that are billed) are based on skilled therapy interventions that are skilled, reasonable and medically necessary. In any given time period, across the entire clinic, these units should be justified by supporting clinical documentation.
The sum total of the total number of timed units and the total number of untimed units is equal to the total number of units billed, which is another analytics component.
19. TOTAL NUMBER OF TIMED UNITS BILLED - The total number of timed units billed in a particular period (based on the data in the claim review page of each note that is finalized by the rendering provider) takes the timed units of all document types into consideration. These document types include the initial evaluation, daily note, progress note, re-evaluation and discharge. Please note that untimed units are not taken into consideration in this analytics component.
The total number of timed units billed (as well as the CPT codes that are billed) are based on skilled therapy interventions that are skilled, reasonable and medically necessary. In any given time period, across the entire clinic, these units should be justified by supporting clinical documentation.
The sum total of the total number of timed units and the total number of untimed units is equal to the total number of units billed, which is another analytics component.
20. TOTAL NUMBER OF UNTIMED UNITS BILLED - The total number of untimed units billed in a particular period (based on the data in the claim review page of each note that is finalized by the rendering provider) takes the untimed units of all document types into consideration. These document types include the initial evaluation, daily note, progress note, re-evaluation and discharge. Please note that timed units are not taken into consideration in this analytics component.
The total number of untimed units billed (as well as the CPT codes that are billed) are based on skilled therapy interventions that are skilled, reasonable and medically necessary. In any given time period, across the entire clinic, these units should be justified by supporting clinical documentation.
The sum total of the total number of timed units and the total number of untimed units is equal to the total number of units billed, which is another analytics component.
21. APPOINTMENT ANALYSIS - The appointment analysis provides a detailed breakdown of the various statuses (New, Cancel, No Show, In Progress and Finalized) for the ‘total scheduled visits’.
It answers questions such as “What percentage of the total scheduled visits are new / cancelled / no shows / in progress/ finalized?”. It is a measure of clinical load and front desk load, and any indications of an unusually large number of new appointments (that are as yet unbinded to a note and therefore are not considered as documented visits), for example, may indicate that a clinician is struggling to document on time. On the other hand, an unusually large number of cancelled / no show appointments may warrant further investigation into clinical or front desk practices.
There is no set standard for the appointment analysis breakdown, and this varies between clinics and providers. It is also dependent on the scheduling actions taken by the front desk, the treatment methodology, documentation time and the complexity of the patients condition, among other factors.
22. DOCUMENTS IN PROGRESS ANALYSIS - Documents in progress analysis provides a detailed breakdown of the various statuses for the ‘total documented visits’. This includes documents in progress and finalized documents.
It answers questions such as “What percentage of the total documented visits are initial evaluations / daily notes / re-evaluations / progress notes / discharges?”. It is a measure of clinical load, and any indications of an unusually large number of initial evaluations, for example, may indicate that a clinician is struggling to complete that document type.
There is no set standard for the documents in progress analysis, and this varies between clinics and providers. It is also dependent on the treatment methodology, documentation time and the complexity of the patient’s condition, among other factors.
23. FINALIZED DOCUMENTS ANALYSIS - Finalized documents analysis provides a detailed breakdown of the various statuses for the ‘finalized visits’. Please note that this does not include documents in progress, this just includes the finalized documents.
It answers questions such as “What percentage of the finalized visits are initial evaluations / daily notes / re-evaluations / progress notes / discharges?”. The daily note is generally expected to be the largest chunk of this chart.
There is no set standard for finalized document analysis, and this varies between clinics and providers.
Clinic Comparator
- Provider List - Allows users to filter the report to a specific provider within the clinic
- Clinic - allows users to filter the report to a specific clinic
- Time Frame - Allows users to filter the report to either 7 days, 15 days or 30 days
- Custom - Allows users to customized the time period of the report
- Discharge Report - when clicked, this will show a pop up that provides all the patients list that has been discharged during the time frame indicated
- New Patient Report - when clicked, it will provide a pop up that lists all the new patients for the time period indicated
- Initial Evaluation report - when clicked, it will provide a pop up that lists all the patients that has a finalized initial evaluation for the time period indicated
- Stats Report per clinic - this will provide the Total Visits, number of Initial Evaluations finalized, Discharged Reports created, and a comparison of both, number of new patients scheduled, Number of Active patients and average visits per patient
Revenue Predictor
- Provider List - Allows users to filter the report to a specific provider within the clinic
- Clinic - allows users to filter the report to a specific clinic
- Time Frame - Allows users to filter the report to either 7 days, 15 days or 30 days
- Custom - Allows users to customized the time period of the report
Payer Visit Breakdown - Payer visit breakdown provides a breakdown of dependence (and dominance) of certain payers in your patient population. It answers questions such as “What percentage of my scheduled visits correspond to which payer?”
For most clinics, 3-4 payers tend to ‘dominate’. Ideally, you want an evenly distributed graph in order to minimize your dependence on a handful of payers.
The more evenly distributed this graph is, the better. There is no set standard for payer visit breakdown, and this graph varies between clinics and providers.
- PAYER VARIANCE - The payer variance depicts the number of scheduled visits and the associated payers, over a period of time. It provides a ‘snapshot’ of which payers are dominant in your patient population. It is common to find 3-4 payers that dominate, with a handful of patients spread out across several payers. It answers questions such as “What is the number of scheduled visits and which payer do they correspond to?”
Ideally, you want an evenly distributed graph in order to minimize your dependence on a handful of payers. The more evenly distributed this graph is, the better. There is no set standard for payer variance, and this graph varies between clinics and providers.

7.DOMINANT ICD CODES (PHYSICIAN DIAGNOSIS) - This counts the number of instances that particular ICD code has been assigned to a patient visit under PRIMARY DIAGNOSIS.

8. DOMINANT ICD CODES (TREATMENT DIAGNOSIS)

The dominant ICD codes (treatment diagnosis) indicator reveals the number of instances that particular ICD code has been assigned to a patient visit in In Touch EMR by the clinician / therapist treating the patient. This diagnosis code is closely related to the plan of care and the services provided to the patient. This metric reveals important trends, and answers questions such as “How many times was a certain ICD code designated by the clinician and for how many visits?”
Appointment Tracking
1 . Appointment Tracking - Appointment tracking is the total duration for all appointment except cancelled, rescheduled, no show appointment for the designated users in the designated time period.
2. Session Tracking - Session tracking is the total active session time for the designated users in the designated time period. Session time is determined by user login time and user logout time. If a user closes a tab or gets logged due to session inactivity, In Touch EMR will assume that the user was actively working upto the end point of session timeout. This may potentially reduce accuracy of session tracking. We strongly recommend that users logout of In Touch EMR at the end of the day for maximum accuracy of session tracking.
3. Total Number of Finalized Visits - In Touch EMR will display all finalized visits in this time period, for the selected providers.
4. A/T Ratio - The 'A/T ratio' or the 'Appointment / Time Ratio' is the ratio between appointment tracking and session tracking. For example, let's say the appointment tracking time is 8 hours (assuming there are 16 patient visits for the day, and each visit is 30 minutes). Let's also say that the session tracking time is 8 hours. The therapist logs in at 9 am and logs out at 1 pm (lunch break). The therapist logs in again at 2 pm and logs out at 6 pm (end of day). In this situation, the A/T ratio is 1. In general, the higher the AT ratio, the higher the productivity of the designated user in the designated time period. A low A/T ratio generally indicates one of two things - too few appointments (a slow day / a wide open schedule, and the clinic may need to step up it's marketing efforts) or a clinician struggling with productivity (too much time spend on clinical care / too much time spent on documentation). Always strive to maximize A/T ratio, and use A/T ratio as a productivity metric to improve the financial strength of your organization.
5. Total Number of Patients - In Touch EMR will display all patients with one or more finalized visits in this time period, for the selected providers.